
Page 28 - ICDEBI2018
P. 28
International Journal of Trend in Scientific Research and Development (IJTSRD) ISSN: 2456-6470
Interpretation:
This data gives a detailed view of whether the costs charged are affordable or not. In here, 59% of the
respondents have positively reacted towards the card payments and have agreed that the online sellers do not
overcharge the debit or credit cards.
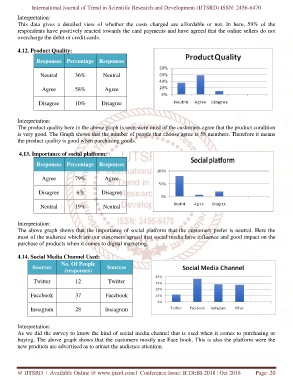
4.12. Product Quality:
Responses Percentage Responses
Neutral 36% Neutral
Agree 58% Agree
Disagree 10% Disagree
Interpretation:
The product quality here in the above graph is seen were most of the customers agree that the product condition
is very good. The Graph shows that the number of people that choose agree is 58 members. Therefore it means
the product quality is good when purchasing goods.
4.13. Importance of social platform:
Responses Percentage Responses
Agree 79% Agree
Disagree 6% Disagree
Neutral 19% Neutral
Interpretation:
The above graph shows that the importance of social platform that the customers prefer is neutral. Here the
most of the audience which are our customers agreed that social media have influence and good impact on the
purchase of products when it comes to digital marketing.
4.14. Social Media Channel Used:
No. Of People
Sources Sources
(responses)
Twitter 12 Twitter
Facebook 37 Facebook
Instagram 28 Instagram
Interpretation:
As we did the survey to know the kind of social media channel that is used when it comes to purchasing or
buying. The above graph shows that the customers mostly use Face book. This is also the platform were the
new products are advertised as to attract the audience attention.
@ IJTSRD | Available Online @ www.ijtsrd.com | Conference Issue: ICDEBI-2018 | Oct 2018 Page: 20