
Page 25 - ICDEBI2018
P. 25
International Journal of Trend in Scientific Research and Development (IJTSRD) ISSN: 2456-6470 | IF: 4.101
4.4. The data collected from the 100 respondents is analyzed and interpreted with the help of tables and
graphs
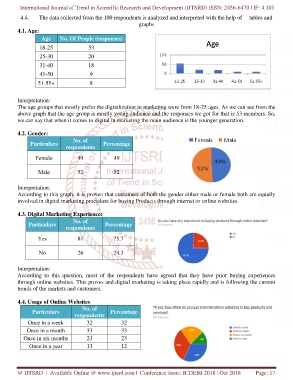
4.1. Age:
Age No. Of People (responses)
18-25 53
25-30 20
31-40 18
41-50 9
51-55+ 8
Interpretation:
The age groups that mostly prefer the digitalization in marketing were from 18-25 ages. As we can see from the
above graph that the age group is mostly young audience and the responses we got for that is 53 members. So,
we can say that when it comes to digital in marketing the main audience is the younger generation.
4.2. Gender:
No. of
Particulars Percentage
respondents
Female 49 49
Male 52 52
Interpretation:
According to this graph, it is proven that customers of both the gender either male or female both are equally
involved in digital marketing procedure for buying Products through internet or online websites.
4.3. Digital Marketing Experience:
No. of
Particulars Percentage
respondents
Yes 81 75.7
No 26 24.3
Interpretation:
According to this question, most of the respondents have agreed that they have prior buying experiences
through online websites. This proves and digital marketing is taking place rapidly and is following the current
trends of the markets and customers.
4.4. Usage of Online Websites
No. of
Particulars Percentage
respondents
Once in a week 32 32
Once in a month 33 33
Once in six months 23 23
Once in a year 13 12
@ IJTSRD | Available Online @ www.ijtsrd.com | Conference Issue: ICDEBI-2018 | Oct 2018 Page: 17