
Page 173 - ICDEBI2018
P. 173
I International Journal of Trend in Scientific Research and Development (IJTSRD) ISSN: 2456International Journal of Trend in Scientific Research and Development (IJTSRD) ISSN: 2456nternational Journal of Trend in Scientific Research and Development (IJTSRD) ISSN: 2456-6470 | IF: 4.101
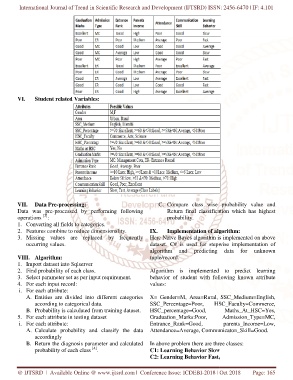
VI. Student related Variables:
VII. Data Pre-processing: C. Compare class wise probability value and Compare class wise probability value and
Data was pre-processed by performing following by performing following Return final classification which has highest eturn final classification which has highest
R
[3]
operations : probability.
1. Converting all fields to categories.
2. Features combine to reduce dimensionality.to reduce dimensionality. IX. Implementation of algorithm:mplementation of algorithm:
I
3. Missing values are replaced by frequently Missing values are replaced by frequently Here Naïve Bayes algorithm is implemented on above Here Naïve Bayes algorithm is implemented on above
occurring values. dataset. C# is used for stepwise implementation of C# is used for stepwise implementation of
a
algorithm and predicting data for unknown lgorithm and predicting data for unknown
VIII. Algorithm: tuple/record.
1. Import dataset into Sqlserver
2. Find probability of each class. Algorithm is implemented to predict learning lgorithm is implemented to predict learning
A
3. Select parameter set as per input requirement.Select parameter set as per input requirement. behavior of student with following known attribute ehavior of student with following known attribute
b
4. For each input record: values:
i. For each attribute:
A. Entities are divided into different categories Entities are divided into different categories X= Gender=M, Area=Rural, SSC_Medium=English, X= Gender=M, Area=Rural, SSC_Medium=English,
H
SSC_Percentage=Poor, SC_Percentage=Poor,
according to categorical data. S HSC_Faculty=Commerce, SC_Faculty=Commerce,
B. Probability is calculated from training dataset.Probability is calculated from training dataset. H Maths_At_HSC=Yes, aths_At_HSC=Yes,
HSC_percentage=Good, SC_percentage=Good,
M
Graduation_Marks:Poor, raduation_Marks:Poor,
A
5. For each attribute in testing dataset G Admission_Type=MC, dmission_Type=MC,
p
i. For each attribute: E parents_Income=Low, arents_Income=Low,
Entrance_Rank=Good, ntrance_Rank=Good,
A. Calculate probability and classify the data Calculate probability and classify the data Attendance=Average, Communicaton_Skill=Good.Attendance=Average, Communicaton_Skill=Good.
accordingly
B. Return the diagnosis parameter and calculated gnosis parameter and calculated In above problem there are three classes: In above problem there are three classes:
[4]
probability of each class . C1: Learning Behavior SlowLearning Behavior Slow
C2: Learning Behavior Fast,2: Learning Behavior Fast,
C
@ IJTSRD | Available Online @ www.ijtsrd.comwww.ijtsrd.com | Conference Issue: ICDEBI-2018 | | Oct 2018 Page: 165