
Page 273 - ICDEBI2018
P. 273
I International Journal of Trend in Scientific Research and Development (IJTSRD) ISSN: 2456International Journal of Trend in Scientific Research and Development (IJTSRD) ISSN: 2456nternational Journal of Trend in Scientific Research and Development (IJTSRD) ISSN: 2456-6470 | IF: 4.101
ANALYSIS AND INTERPRETATIONANALYSIS AND INTERPRETATION RETURN ON EQUITY:
ASSETS ROE is the amount of net income returned as a is the amount of net income returned as a
percentage of shareholders' equity. Return on equity ercentage of shareholders' equity. Return on equity
2017 2016 2015 20142014 2013 p
measures a corporation's profitability by revealing easures a corporation's profitability by revealing
Canara 3885 3365 5480 49194919 4123 m
h
bank 18 45 0.56 21.8521.85 42.61 how much profit a company generates with the money ow much profit a company generates with the money
Union bank 3193 3163 3816 53575357 3118 shareholders have invested.
of India 83 93 15.93 80.9080.90 60.81
RETURN ON ASSET:
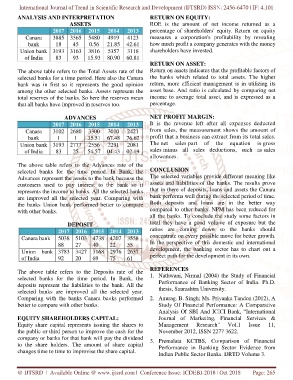
The above table refers to the Total Assets rate of the The above table refers to the Total Assets rate of the Return on assets indicates that the profitable factors of assets indicates that the profitable factors of
selected banks for a time period. Here also the Canara for a time period. Here also the Canara the banks which related to total assets. The higher the banks which related to total assets. The higher
bank was in first so it represents the good opinion bank was in first so it represents the good opinion return, more efficient management is in utilizing its return, more efficient management is in utilizing its
among the other selected banks. Assets represent the among the other selected banks. Assets represent the asset base. And ratio is calculated by comparing net asset base. And ratio is calculated by comparing net
total reserves of the banks. So here the reserves mean total reserves of the banks. So here the reserves mean income to average total asset, and is expressed aincome to average total asset, and is expressed as a
that all banks have improved in reserves too.that all banks have improved in reserves too. percentage.
ADVANCES NET PROFIT MARGIN:
2017 2016 2015 20142014 2013 It is the revenue left after all expenses deducted is the revenue left after all expenses deducted
Canara 3102 2680 3300 30103010 2421 from sales, the measurement shows the amount of measurement shows the amount of
profit that a business can extract from its total sales. rofit that a business can extract from its total sales.
bank 1 1 35.51 67.4867.48 76.62 p
Union bank 3193 2777 2556 22912291 2081 The net sales part of the equation ispart of the equation is gross
of India 83 25 54.57 04.4304.43 02.19 sales minus all sales deductions, such asminus all sales deductions, such as sales
allowances.
The above table refers to the Advances rate of the The above table refers to the Advances rate of the
selected banks for the time period. In Bank, the selected banks for the time period. In Bank, the CONCLUSION
The selected variables provide different meaning like he selected variables provide different meaning like
Advances represent the assets to the bank because the represent the assets to the bank because the T
assets and liabilities of the banks. The results prove ssets and liabilities of the banks. The results prove
customers used to pay interest to the bank so it customers used to pay interest to the bank so it a
t
represents the income to banks. All the selected banks represents the income to banks. All the selected banks that in there of deposits, loans and assets the Canara hat in there of deposits, loans and assets the Canara
are improved all the selected year. Comparing with are improved all the selected year. Comparing with bank performs well during the selected period of time. performs well during the selected period of time.
Both deposits and loans are in the better way oth deposits and loans are in the better way
the banks Union bank performed better to compare the banks Union bank performed better to compare B
c
with other banks. compared to other banks. NPM has been reduced for ompared to other banks. NPM has been reduced for
a
all the banks. To conclude the study some factors in ll the banks. To conclude the study some factors in
t
DEPOSIT total they have a good volume of exposure but the otal they have a good volume of exposure but the
ratios are coming down so the banks should are coming down so the banks should
2017 2016 2015 2014 2013
c
concentrate on every possible move for better growth. oncentrate on every possible move for better growth.
Canara bank 5038 5103 4738 4207 3558
In the perspective of this domestic and international n the perspective of this domestic and international
I
88 27 40 22 55
development, the banking sector has to chart out a evelopment, the banking sector has to chart out a
d
Union bank 3783 3427 3168 2976 2637
perfect path for the development in its own.erfect path for the development in its own.
p
of India 92 20 69 75 61
The above table refers to the Deposits rate of the The above table refers to the Deposits rate of the REFERENCES
1. Nathwani, Nirmal (2004) thwani, Nirmal (2004) the Study of Financial
selected banks for the time period. In Bank, the selected banks for the time period. In Bank, the
P
Performance of Banking Sector of India. Ph.D. erformance of Banking Sector of India. Ph.D.
deposits represent the liabilities to the bank. All the deposits represent the liabilities to the bank. All the
t thesis, Saurashtra University. hesis, Saurashtra University.
selected banks are improved all the selected year. selected banks are improved all the selected year.
Comparing with the banks Canara banks performed Comparing with the banks Canara banks performed 2. Anurag. B. Singh; Ms. Priyanka Tandon (2012), A Anurag. B. Singh; Ms. Priyanka Tandon (2012), A
better to compare with other banks. S
Study Of Financial Performance: A Comparative tudy Of Financial Performance: A Comparative
Analysis Of SBI And ICICI Bank, “InternAnd ICICI Bank, “International
J
EQUITY SHAREHOLDERS CAPITAL: EQUITY SHAREHOLDERS CAPITAL: Journal of Marketing, Financial Services & ournal of Marketing, Financial Services &
Equity share capital represents issuing the shares to suing the shares to M Research” esearch” V I Issue ssue 11, 1,
R
Management anagement
Vol.1 ol.1
1
the public or third person to improve the cash for the the public or third person to improve the cash for the November 2012, ISSN 2277 3622. ovember 2012, ISSN 2277 3622.
N
company or banks for that bank will pay the dividend will pay the dividend
3. Premalata KCTBS, Comparison, Comparison of Financial
to the share holders. The amount of share capital to the share holders. The amount of share capital
P
Performance in Banking Sector Evidence from erformance in Banking Sector Evidence from
changes time to time to improvise the share capital. changes time to time to improvise the share capital.
I Indian Public Sector Banks. IJRTD Volume 3.ndian Public Sector Banks. IJRTD Volume 3.
@ IJTSRD | Available Online @ www.ijtsrd.comwww.ijtsrd.com | Conference Issue: ICDEBI-2018 | | Oct 2018 Page: 265